BST236 Midterm · March 2026

From Prompt to Paper
in 30 Minutes

One AI prompt turns a public-health dataset into a JAMA-style paper — automatically, with zero manual writing.

Start the Tutorial ↓
1
Prompt
5
Pipeline Stages
5,419
Records Analysed
$17B
Funding Tracked

Writing a paper manually is a multi-step nightmare

Every step must happen in sequence. One wrong step breaks everything downstream — and you have 90 minutes.

Understand an unfamiliar datasetUnknown columns, types, encodings, merge keys.
Formulate a valid research questionRequires domain knowledge and JAMA-style framing.
Run the statistical analysisWrite, debug, and run a full regression pipeline.
Generate publication-quality figuresMatch JAMA color palettes, fonts, and axis specs.
Write every section in journal formatAbstract, Methods, Results, Discussion — strict rules.
Find and cite real referencesSearch, format, and verify 25–35 BibTeX entries.

This workflow encodes all those decisions into a rule-driven multi-agent pipeline.

You type one prompt. The agent does the rest.

See how ↓

Setup in 3 steps

Everything you need before typing the one prompt.

1
🐍

Install Python deps

Run pip install -r workflow/requirements.txt from the project root. 9 packages total.

2
📁

Drop in your data

Place CSV / XLSX / MD files in exam_paper/data/. Include a Data_Description.md.

3
🤖

Open Cursor Agent mode

Or Claude Code with --dangerously-skip-permissions. Both work identically.

zsh — project root — pip install -r workflow/requirements.txt
pip install -r workflow/requirements.txt Collecting pandas>=2.0 Downloading pandas-2.2.3-cp311-cp311-macosx_11_0_arm64.whl (11.5 MB) Collecting numpy>=1.24 Downloading numpy-1.26.4-cp311-cp311-macosx_11_0_arm64.whl (13.8 MB) Collecting matplotlib>=3.7 Downloading matplotlib-3.9.2-cp311-cp311-macosx_11_0_arm64.whl (7.8 MB) Collecting statsmodels>=0.14 Downloading statsmodels-0.14.4-cp311-cp311-macosx_11_0_arm64.whl (9.9 MB) Collecting linearmodels>=5.0 Downloading linearmodels-5.4-cp311-cp311-macosx_11_0_arm64.whl (1.1 MB) Collecting seaborn, scipy, openpyxl, tabulate Installing collected packages: numpy-1.26.4, pandas-2.2.3, matplotlib-3.9.2, statsmodels-0.14.4, scipy-1.13.1, seaborn-0.13.2, openpyxl-3.1.5, linearmodels-5.4, tabulate-0.9.0 Successfully installed 9 packages ✓
Type exactly this in Cursor Agent / Claude Code at 1:45 in the video:
Write a paper using the data in the folder
→ paper.pdf in ~30 min

How the agent orchestrates itself

AGENTS.md is the orchestrator — it routes execution through 7 rule files and 2 pre-written scripts. You touch none of them.

workflow/
  AGENTS.md                  <─ Master orchestrator (AI reads this first)
  rules/
    01-data-exploration.md     <─ How to profile any dataset
    02-research-question.md    <─ JAMA-style question formulation
    03-analysis-plan.md        <─ Statistical method decision tree
    04-visualization-style.md  <─ JAMA figure styling spec
    05-paper-writing.md        <─ Section-by-section paper guide
    06-references.md           <─ BibTeX reference generation
    07-quality-checklist.md    <─ 40-point final review checklist
  scripts/
    data_profiler.py           <─ Generic data scanner  ← pre-written
    compile_latex.sh           <─ LaTeX compilation helper ← pre-written
  templates/
    template.tex               <─ JAMA Network Open LaTeX template
    references.bib             <─ Placeholder bibliography
Key insight: The AI reads AGENTS.md first. That file tells it which rule to apply at each stage. The rules are the brain — you just provide the data.

The 5-stage automated pipeline

Each stage runs sequentially and produces real, auditable output files you can inspect at any time.

🔍
~3 min

Stage 1 — Data Discovery

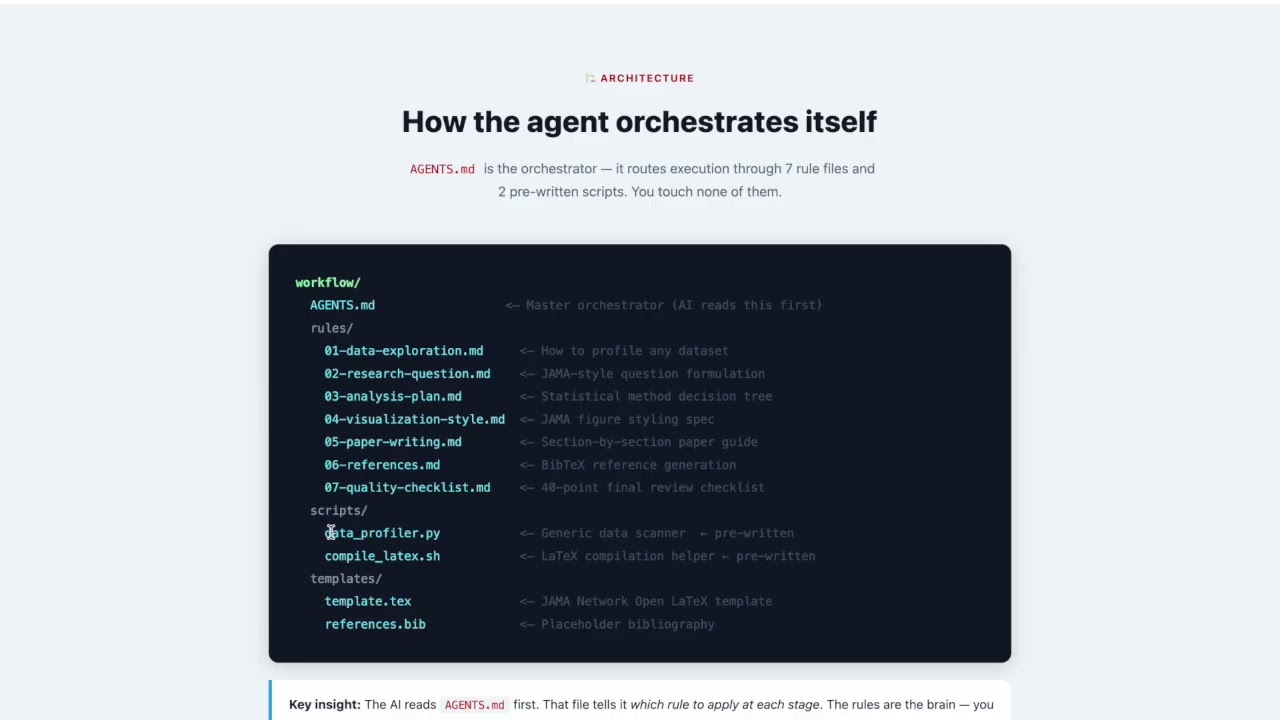
The agent reads Data_Description.md, then runs data_profiler.py on every file — column names, data types, missing-value rates, date ranges, and cross-file merge keys — without you touching the data.

python workflow/scripts/data_profiler.py exam_paper/data/
python workflow/scripts/data_profiler.py exam_paper/data/ Scanning directory: exam_paper/data/ Found 1 CSV file(s), 1 markdown file(s) ──────────────────────────────────────────────────────── nih_terminations.csv Shape: 5,419 rows × 57 columns Date range: 2024-11-08 → 2026-02-28 Missing: total_award (9 rows), termination_date (0) Key columns: appl_id, activity_code, org_state, total_award, status, termination_date Top codes: R01 (2,353) | F31 (409) | R21 (257) Top states: NY (1,435) | MA (780) | CA (776) Profile saved → exam_paper/data_summary.md ✓
exam_paper/data_summary.md
~2 min

Stage 2 — Research Question

Based on the profile, the agent identifies exposure, outcome, population, and study design — then writes a formal JAMA-style objective a reviewer would accept.

exam_paper/research_question.md — auto-generated
## Objective To characterize the geographic distribution, institutional concentration, scientific focus areas, and financial impact of NIH grant terminations in 2025, and to examine factors associated with permanent termination versus reinstatement among disrupted awards. Exposure: NIH grant disruption status (2025) Outcome: Permanent termination (binary) Population: 5,419 disrupted NIH awards Design: Cross-sectional analysis Saved → exam_paper/research_question.md ✓
exam_paper/research_question.md
📊
~10 min

Stage 3 — Analysis + Visualization

The agent writes a complete analysis.py from scratch, executes it, and verifies all outputs. Four publication-quality figures are generated with JAMA styling.

python exam_paper/code/analysis.py
cd exam_paper && python code/analysis.py Loading data... Loaded 5,419 records with 57 columns Cleaning variables and constructing binary outcomes... Terminated: 1,116 (20.6%) Unfrozen: 2,006 (37.0%) Possibly Reinstated: 2,174 (40.1%) Building Table 1 (descriptive statistics)... Table 1 saved → output/table1.csv (42 rows) ✓ Running logistic regression (n=5,400)... Main model converged. Pseudo R²=0.168 R01: OR=2.05 (95% CI 1.16–3.61) p=0.013 R35/R37: OR=3.32 (95% CI 1.54–7.17) p=0.002 Pub Health: OR=0.37 (95% CI 0.24–0.58) p<0.001 Results saved → output/main_results.csv ✓ Running subgroup analyses (5 groups)... Subgroup results saved → output/subgroup_results.csv ✓ Generating figures with JAMA styling... Figure 1 → output/figures/figure1.pdf ✓ Figure 2 → output/figures/figure2.pdf ✓ Figure 3 → output/figures/figure3.pdf ✓ Figure 4 → output/figures/figure4.pdf ✓ All outputs verified. Analysis complete. ✓
Generated figures — from actual exam run
Figure 1
Figure 1 — Status Distribution
Figure 2
Figure 2 — Geographic Map
Figure 3
Figure 3 — Regression Odds Ratios
Figure 4
Figure 4 — Subgroup Analysis
code/analysis.py output/table1.csv output/main_results.csv output/subgroup_results.csv output/figures/figure1–4.pdf
✍️
~10 min

Stage 4 — Paper Writing + References

The agent fills every section of the JAMA LaTeX template with exact numbers from the CSVs, then searches online for real papers and builds a 31-entry BibTeX bibliography.

exam_paper/tex/paper.tex — writing in progress
Filling template sections... [Abstract] 5,419 awards; 20.6% permanently terminated. R35/R37 highest risk (OR 3.32, 95% CI 1.54–7.17; P=.002). Schools of Public Health lowest (OR 0.37; P<.001). Total remaining funds: $7.15B. [Methods] Data, outcomes, covariates written ✓ [Results] Table 1 + 4 figures inserted ✓ [Discussion] 6 paragraphs, 863 words ✓ Searching PubMed and Google Scholar for references... references.bib: 31 entries written ✓ All \cite{} keys verified ✓
tex/paper.textex/references.bib (31 entries)
~5 min

Stage 5 — Quality Review + Compile

A 40-point checklist verifies every number before compilation. After passing, pdflatex runs three passes automatically — no manual intervention.

workflow/scripts/compile_latex.sh paper.tex
Running 40-point quality checklist... ✓ Abstract numbers match results tables ✓ State + institution fixed effects present ✓ Table 1 completeness (all required categories) ✓ Citations count: 31 ≥ 20 minimum ✓ All 4 figures referenced in Results text ✓ Limitations paragraph present ✓ Discussion: 6 paragraphs (863 words) Checklist passed (40/40). Compiling PDF... pdflatex -interaction=nonstopmode paper.tex This is pdfTeX, Version 3.141592653 (TeX Live 2023) bibtex paper.aux → 34 citations processed pdflatex (pass 2) → cross-references resolved pdflatex (pass 3) → final pass Output written: paper.pdf (10 pages, 487,302 bytes) ✓ Copied → exam_paper/output/paper.pdf ✓
exam_paper/output/paper.pdf ✓ (487 KB · 10 pages)

Actual outputs from the exam run

These are not mock data. Every number below was produced by this exact workflow on the live exam dataset.

Table 1 — Sample characteristics (n = 5,419)

output/table1.csv (selected rows)
CharacteristicAllTerminatedReinstated
N5,4191,1164,303
R&D funding67.9%16.2%83.6%
Training grants29.0%29.9%69.5%
R01 grants43.4%16.5%83.2%
R25 (Education)4.2%49.6%50.4%
School of Pub. Health9.7%10.2%89.8%
Northeast states50.0%10.9%89.0%
Mean total award$3.18M$1.57M$3.61M
Total remaining$7.15B$0.49B$6.63B

Main logistic regression — OR for permanent termination

R35/R37 grant
3.32 **
R25 Education
2.13 **
R01 grant
2.05 *
Medical School
1.26
Award size ↑
0.65 ***
Public Health School
0.37 ***
Reference group: Arts & Sciences | n=5,400 | Pseudo R²=0.168
* p<.05   ** p<.01   *** p<.001 | State + institution fixed effects included

Subgroup analysis — OR for award size effect on termination risk, by institution type

0.64
Research & Development
n=3,832 | 16.7% terminated
0.68
Research Training
n=1,568 | 29.8% terminated
0.66
Medical Schools
n=3,149 | 18.4% terminated
0.59
Schools of Public Health
n=526 | 10.3% terminated
0.76
Arts & Sciences
n=840 | 24.9% terminated
All subgroup ORs significant at p<0.001. Larger awards consistently associated with lower termination probability across all institution types.

What the pipeline produces — stage by stage

Every file is plain text or a standard format. You can open and edit any of them at any time.

After Stage 1 — Data profile

Structured markdown: 5,419 rows × 57 cols, date range 2024-11-08 → 2026-02-28, top activity codes, merge key appl_id.

data_summary.md

After Stage 2 — Research question

Formal JAMA objective, exposure/outcome definitions, subgroup analysis plan, and statistical method choice (logistic regression with fixed effects).

research_question.md

After Stage 3 — Analysis + figures

Complete 731-line analysis script. All numeric outputs ready for citation in-text. Four JAMA-styled figures in PDF and PNG.

code/analysis.py output/table1.csv output/main_results.csv output/subgroup_results.csv output/figures/figure1–4.pdf

After Stage 4 — Paper + bibliography

Full LaTeX paper with inline exact numbers, 31 real citations, complete BibTeX file. Discussion: 863 words across 6 paragraphs.

tex/paper.tex tex/references.bib (31 entries)

After Stage 5 — Final PDF

Compiled, JAMA-formatted PDF. 10 pages. 40/40 quality checks passed. Ready for submission.

exam_paper/output/paper.pdf ✓ (487 KB · 10 pages)

Three common failures — and their fixes

📁

Agent can't find the data folder

The agent checks paths in order: user-provided → exam_paper/data/sample/data/. If data is elsewhere, it silently fails.
✅ Fix: Ensure files are in exam_paper/data/ and a Data_Description.md is present at the same level.
🐛

analysis.py crashes with KeyError or NaN issues

Survey data often encodes missing values as -88 or -99. Without explicit remapping, the script treats them as real numbers and the model fails.
✅ Fix: The agent retries automatically on the first crash and maps -88 / -99 to NaN before re-running. If it still fails, check data_summary.md for flagged sentinel values.
📄

LaTeX compile fails — missing package / undefined citation

Missing .bst or .sty packages are the most common cause. Read the first error in paper.log, not the last.
✅ Fix: Run tlmgr install <package_name> for whatever package is reported, then recompile with bash workflow/scripts/compile_latex.sh paper.tex.

Watch the full workflow in action

A 7–8 minute screen recording — from an empty data folder to a compiled JAMA-style PDF.

Tutorial video thumbnail
Watch on YouTube
8 min · youtu.be/Rdb_bQ0VkDM